
Before the dashboard: can the business trust its numbers?
Dashboards fail when definitions and data quality are left for later. Start underneath.
- Author
- Orivion editorial
- Published
- Last reviewed
- Reading time
- 5 min
Written from Orivion's delivery practice.
Why this matters
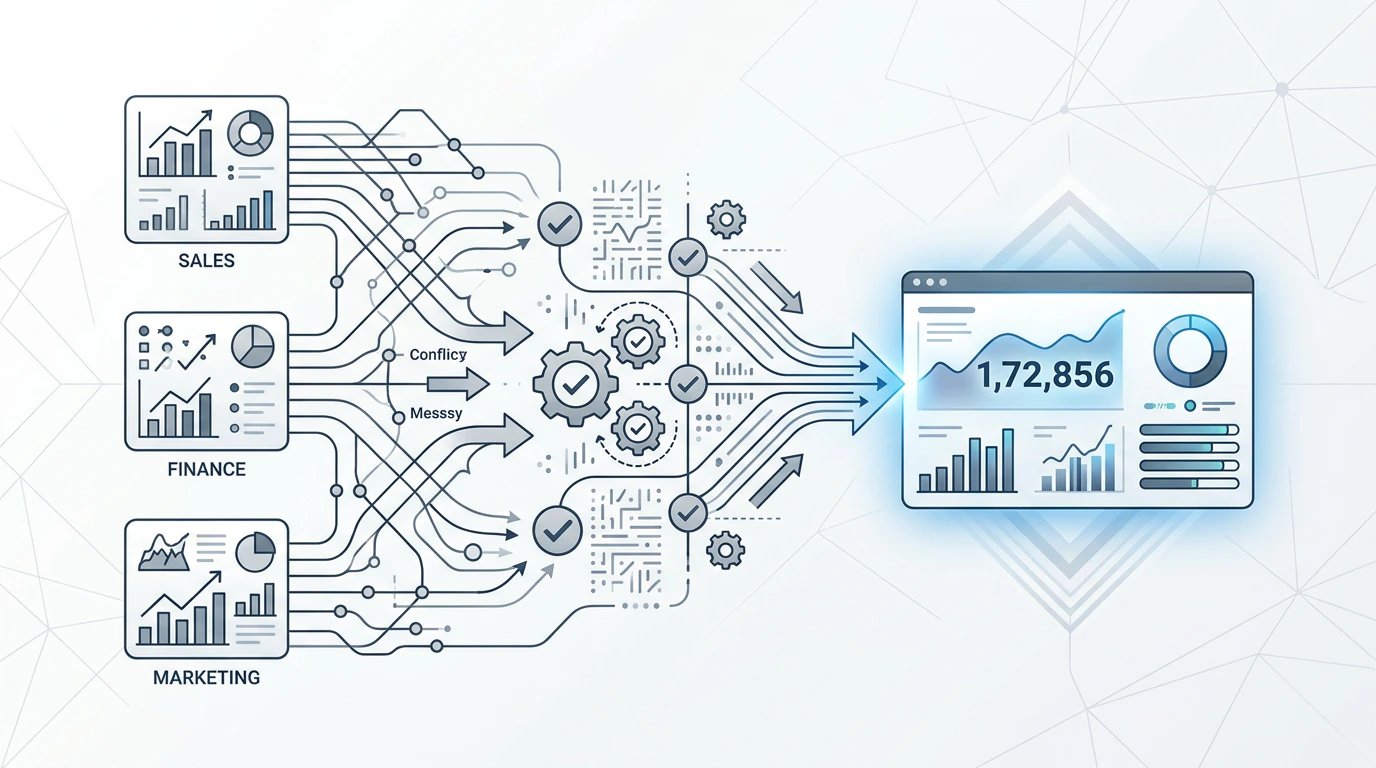
A dashboard is the most visible part of a data project and the least important. If finance, sales and marketing each calculate revenue differently, a better chart simply displays the disagreement more clearly.
Definitions first
Pick the ten metrics leadership actually uses. For each, write the calculation, the source systems, the inclusions and exclusions, and the owner. This single document resolves more reporting arguments than any tool.
Quality rules second
Profile the data behind each metric: duplicates, missing values, inconsistent codes and late updates. Turn the important checks into automated tests that run with every refresh.
One semantic layer
Modern platforms, Microsoft Fabric among them, bring ingestion, storage, transformation, semantic models and reporting into one governed flow. The key idea is a single semantic model that every report uses, so a metric means the same thing everywhere.
Signs the problem is underneath the dashboard
- Two reports show different totals for the same metric.
- Month-end reporting needs manual reconciliation.
- People export data to spreadsheets to check the dashboard.
- Nobody can say who owns a metric's definition.
- Pipelines fail without anyone being alerted.
What to do next
Choose one metric that causes arguments. Define it, trace its sources and reconcile it. The process will show you what the rest of the programme needs.
Information on this site is general. It is not legal, tax or financial advice. Requirements change, so confirm current rules with the relevant authority or a licensed adviser.
Related articles
Keep reading.
- AI & Automation7 min readRules, AI or an agent? Choosing the right kind of automationMost workflows need less AI than the pitch suggests, and more control than the demo shows. A practical way to choose per step.Read
- UAE Market Entry6 min readUAE eInvoicing: what changes, when, and what to check nowMandatory electronic invoicing arrives in phases from 2027. It is a data and systems project as much as a compliance one.Read
- Digital Strategy4 min readChoose the CRM before the first customerDesigning customer data early is faster than untangling it later.Read
Want to talk through how this applies to your business?