
Run / Data & Business Intelligence
Don't start with the dashboard. Start with whether the data can be trusted.
Orivion provides data engineering and business intelligence consulting from Dubai for UAE and international teams. Most companies have reports. Fewer can answer a simple question, such as how much revenue came from returning customers last quarter, and get the same answer from finance, sales and marketing. We fix the layer underneath the dashboard: sources, pipelines, quality rules and shared definitions. Then the dashboards become worth looking at.
The problem
Can everyone in your business trust the same number?
When they cannot, meetings turn into arguments about whose spreadsheet is right.
- The same metric defined differently in each department
- Data spread across CRM, finance, ecommerce and spreadsheets
- Spreadsheets quietly acting as operational databases
- Manual exports and copy-paste behind every monthly report
- Pipelines that break without anyone noticing
- Dashboards nobody uses because nobody trusts them
- Duplicate customers and inconsistent product data
Why it matters
Why it matters
Decisions made on inconsistent numbers are guesses with extra steps. The cost shows up as slow reporting cycles, misallocated budgets and effort spent reconciling rather than analysing.
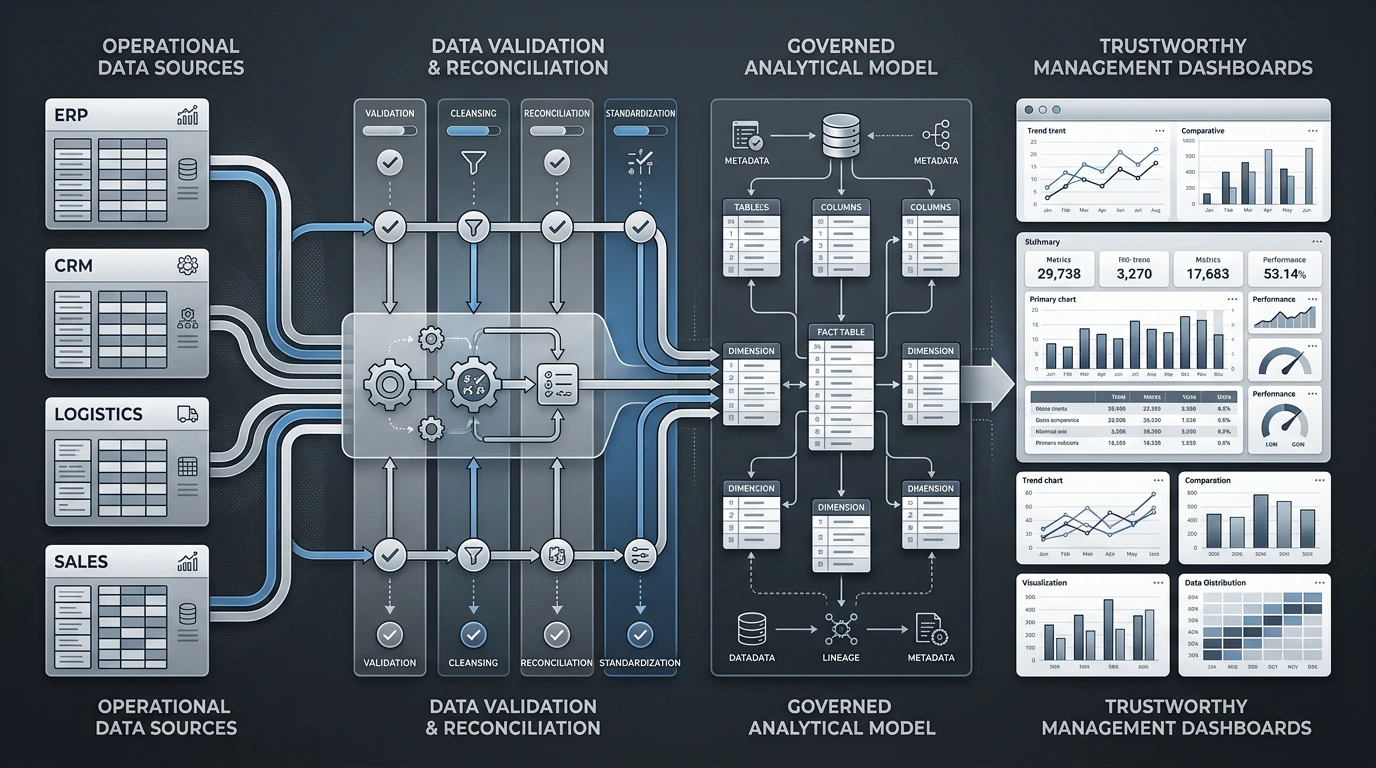
Modern data platforms connect ingestion, storage, transformation, semantic models and reporting in one governed flow rather than in isolated tools. The technology matters, but the lasting value comes from agreed definitions and data quality rules, which is where we start.
The data flow
From source systems to decisions.
Every stage has an owner and a quality check, so problems are caught before they reach a dashboard.
Sources
- CRM
- Finance
- Commerce
- Operations
Ingest
- Connectors
- APIs
- Schedules
- Events
Quality
- Validation
- Deduplication
- Reconciliation
Model
- Transformations
- Definitions
- Semantic layer
Analyse
- Dashboards
- Alerts
- Self-service
Decide
- Reviews
- Forecasts
- Action
Capabilities
What Orivion can deliver.
Data pipelines, trusted metrics, dashboards and analytics the whole business can rely on.
Business intelligence
- Power BI
- Tableau
- Looker
- Executive dashboards
- Operational dashboards
Analytics
- Sales and pipeline analytics
- Financial analytics
- Marketing analytics
- Customer analytics
- Operations analytics
- KPI frameworks
Data engineering
- ETL and ELT
- Pipelines and orchestration
- API ingestion
- Cleansing and reconciliation
- Data migrations
Data management
- Master and customer data
- Data quality rules
- Semantic models
- Metric definitions
- Governance and ownership
Platforms
- Microsoft Fabric
- Data warehouses
- Data lakes and lakehouses
- BigQuery
- Snowflake where appropriate
Digital analytics
- GA4
- Event tracking plans
- Google Tag Manager
- Product analytics
Advanced analytics
- Segmentation
- Forecasting
- Anomaly detection
- Predictive models where the problem justifies them
Use cases
What clients hire this for.
Representative problems this service is used to solve.
One revenue number
Reconcile CRM, billing and finance data under agreed definitions so revenue reporting matches across teams.
Sales pipeline visibility
Model stages and conversion consistently, then report pipeline health, forecast and velocity by team and source.
Marketing attribution
Connect campaign data to CRM outcomes so spend can be compared on qualified leads and revenue, not clicks.
Operational dashboard
Give operations live visibility of volumes, backlogs and service levels with alerts for exceptions.
Customer 360
Combine customer records from sales, service and commerce into one trusted profile for analysis and activation.
Replace monthly spreadsheet reporting
Automate the pipeline behind recurring reports so month-end reporting takes hours rather than days.
Methodology
Built from the question backwards
We begin with the decisions the business needs to make and work back to the data that supports them.
01
Business question
Which decisions need data, who makes them and how often.
02
Source inventory
Every relevant system, its owner, access method and refresh needs.
03
Data quality
Profile the data, find gaps and duplicates, and agree quality rules.
04
Ingestion
Reliable, monitored pipelines from each source.
05
Transformation
Clean, join and model the data into analysis-ready tables.
06
Business definitions
Agree how each metric is calculated, with a named owner.
07
Semantic model
One governed layer that every report uses.
08
Analytics
Dashboards and reports designed around the original questions.
09
Validation
Reconcile outputs with trusted figures before rollout.
10
Monitoring
Pipeline alerts, freshness checks and a change process for definitions.
Deliverables
What you receive.
The exact set depends on scope. These are typical for an engagement of this kind.
- Data source inventory and access map
- Data quality assessment
- Pipelines with monitoring and alerts
- Documented metric definitions with owners
- Semantic model
- Dashboards and reports
- Tracking plan for digital analytics where in scope
- Governance and access model
- Training for report users and data owners
Technology
Platforms chosen for the problem.
We work in your existing ecosystem where possible. Typical platforms include:
BI
- Power BI
- Tableau
- Looker
- Looker Studio
Platforms
- Microsoft Fabric
- BigQuery
- Snowflake
- Azure Synapse
- PostgreSQL
Pipelines
- dbt
- Azure Data Factory
- Fivetran
- Airbyte
- Custom connectors
Digital analytics
- GA4
- Google Tag Manager
- Server-side tagging
Security and governance
Governance without bureaucracy
Enough structure that numbers can be trusted, not so much that nobody can get an answer.
Metric ownership
Every key metric has a written definition and a person responsible for it.
Access control
Row and role-level security so people see the data appropriate to their role.
Data quality checks
Automated tests on freshness, completeness and reconciliation.
Privacy
Personal data minimised, retained according to policy and handled under applicable data protection law.
Engagement models
How this is usually delivered.
Commonly delivered as a managed project for the first data model and dashboards, then continued by a small dedicated team or support plan as new sources and questions are added.
Proof
How we would approach it.
Capability demonstrations show how Orivion would approach a problem. They are not client projects and carry no client results.
Related capabilities
Services that usually connect to this one.
- RunCRM, Sales & Customer SystemsThe customer journey from first enquiry to retention, connected in one system.
- RunAI & AutomationWorkflow automation, document processing, AI assistants and agents, with controls built in.
- GrowDigital Marketing & GrowthSearch, paid media, lifecycle and conversion, measured against customer value.
- BuildSoftware Engineering & CloudCustom applications, APIs, integrations, cloud and DevOps designed around your operation.
FAQ
Questions buyers ask
What should we prepare before starting a BI or dashboard project?
Identify the decisions the reports need to support, the people who own each source and how the business defines its key measures. We review data access, quality and refresh requirements before choosing the platform and designing dashboards. Software licensing and third-party costs are scoped separately.
We already have dashboards. Why start with data quality?
Because dashboards built on inconsistent data produce confident-looking wrong answers. A short data quality and definitions review usually explains why existing dashboards are not trusted, and what to fix first.
Power BI, Tableau or Looker?
Your existing licences and ecosystem usually decide it. Power BI fits Microsoft environments, Looker fits Google Cloud, and Tableau is strong for exploratory analysis. The semantic model matters more than the tool.
Do we need a data warehouse?
If you combine data from several systems regularly, yes, in some form. For smaller needs a well-designed database or Fabric workspace can be enough. We size the platform to the problem.
Can you work with data from our CRM and ecommerce platform?
Yes. Most platforms offer APIs or connectors. We build monitored pipelines and reconcile the results against the source systems.
When is predictive analytics worth it?
When there is enough reliable history, a decision that a forecast would change, and a way to act on it. Descriptive reporting done well often delivers more value first.
Tired of arguing about whose number is right? Let us look at your data together.